Satisfaction report
Read your average survey score, the share of happy customers, how many answered the survey, the split of scores from 1 to 5 and their latest comments.
On this page
Analytics > Satisfaction reports on the survey customers get after their ticket is closed, where they score the conversation from 1 to 5 and can add a comment. It has figures only once the survey is switched on in Workflows > Satisfaction survey; see Satisfaction surveys.
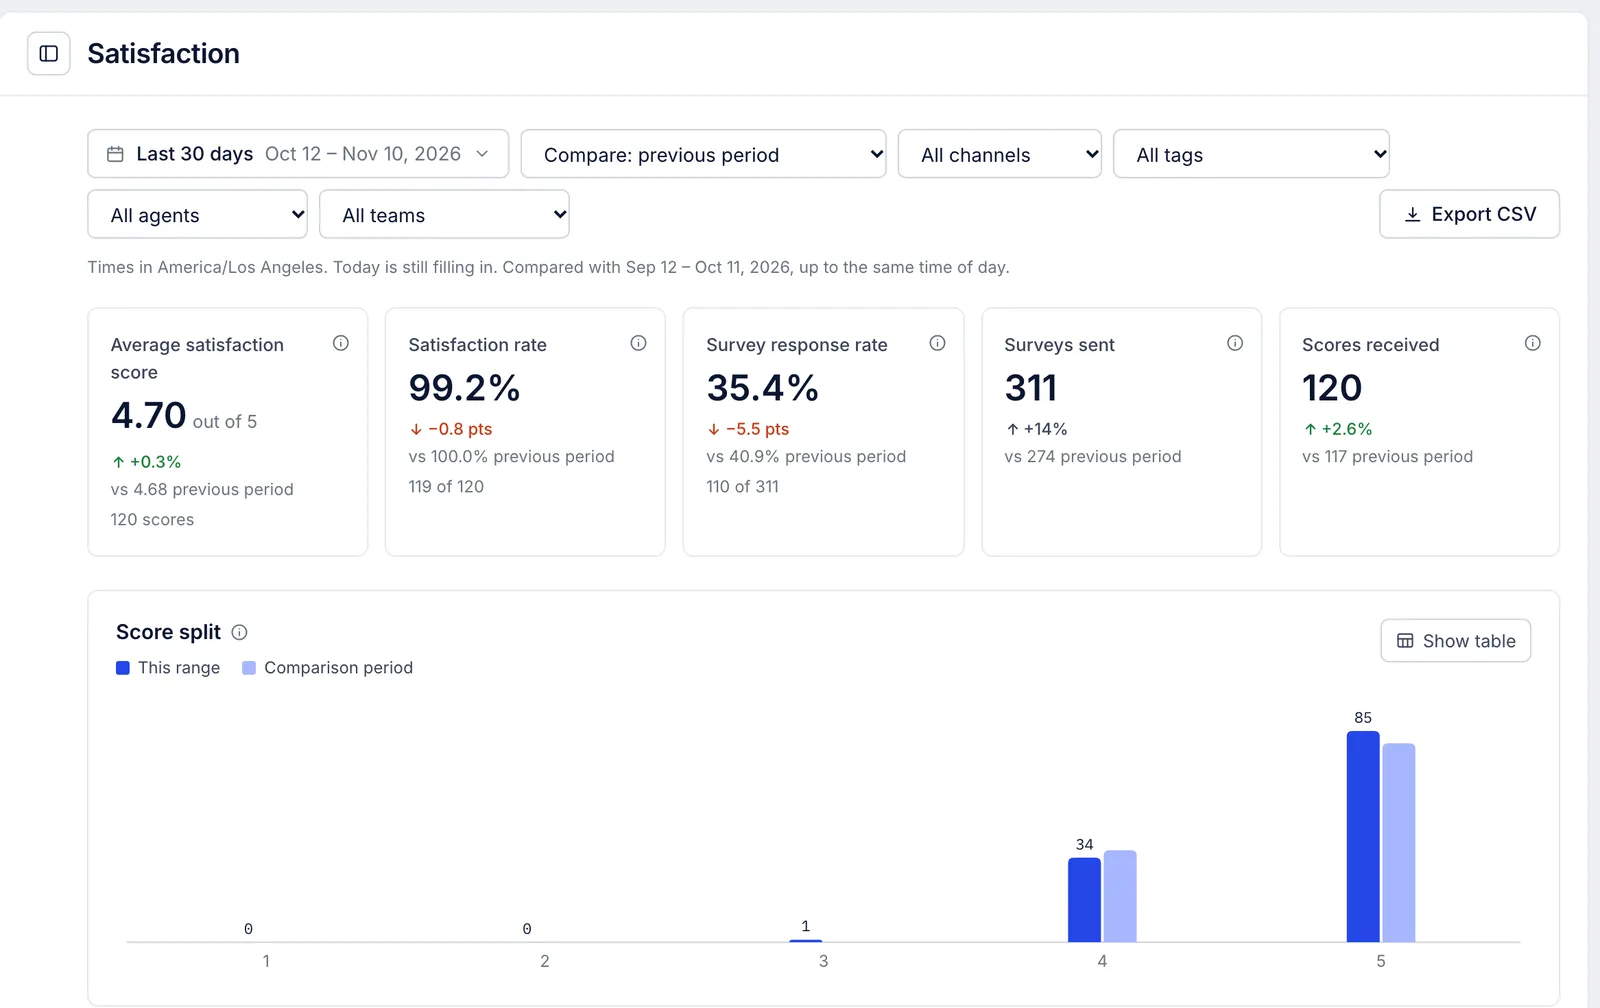
The five figures#
| Figure | What it shows |
|---|---|
| Average satisfaction score | The mean of the scores customers gave in the range, out of 5, with how many scores it uses |
| Satisfaction rate | The share of those scores that were a 4 or a 5, for example "119 of 120" |
| Survey response rate | Of the surveys sent in the range, the share customers have answered so far |
| Surveys sent | Surveys that went out in the range |
| Scores received | Scores customers gave in the range |
Each figure shows its change against the comparison period. The two rates move by percentage points ("pts").
Which date a score belongs to#
Scores and survey sends are dated differently, and the difference explains most surprises in this report:
The average, the satisfaction rate and scores received use the day the customer gave the score. A survey sent last week and answered today counts today.
Surveys sent and the response rate use the day the survey went out. A survey answered after the range ended still counts as answered, so the response rate for a recent range creeps up for a while as late answers come in.
That is why Scores received and the answered part of Survey response rate rarely match: one counts scores given in the range, the other counts surveys sent in the range that have been answered at any time.
A survey nobody answered does not pull the average or the satisfaction rate down. It only lowers the response rate.
Charts and comments#
Score split shows how many of each score from 1 to 5 customers gave, next to the comparison period. A rise in 3s can warn you before the average moves.
Average satisfaction score over time follows the average, the satisfaction rate or the number of scores across the range; choose one with the buttons above the chart. A day or week without any score has no point.
Latest comments lists up to 25 of the newest comments customers wrote with their score, newest first, with the score, the ticket number and when it was given. Click the ticket number to open the conversation. The list never shows the customer's name or email address.
Narrow it down#
Use the Channel, Tag, Agent and Team menus at the top to see the scores for one slice. With an agent picked, a score counts for the person the ticket is assigned to now, not whoever sent the last reply.
To compare scores side by side, use the Satisfaction score column in the Agents, Channels and Tags reports. Each shows the average with the number of scores behind it in brackets; an average of three scores says little.
There is no filter by score. To read the low scores, look at the score split and the comments, or open the tickets from the comment list.
Export#
Export CSV downloads the trend: one row per day, week or month with the average score, satisfaction rate and scores received, then a row for the whole range that adds how many of each score from 1 to 5 were given. Comments are left out of the file because they are the customer's own words.
Automatic quality scoring of conversations is not available; the satisfaction survey is the only quality measure in the reports.
Related articles
- Satisfaction surveysEmail customers a one-question survey after their ticket closes, choose which tickets get one, and find the scores and comments they send back.
- Agent performanceCompare each person's replies, closed tickets, response and resolution times, one-touch rate and satisfaction score, and narrow the report to one team.
- Tags reportSee which tags come up most, how many tickets carry no tag, and how quickly and how well each kind of ticket is resolved.
- How each metric is countedThe exact rule behind every figure in Analytics, from tickets created to one-touch rate and survey response rate, and the rules all reports share.
Still stuck?
Write to the Growth Dept team and a person answers. Say which helpdesk you work in and what you were trying to do.