Analytics overview
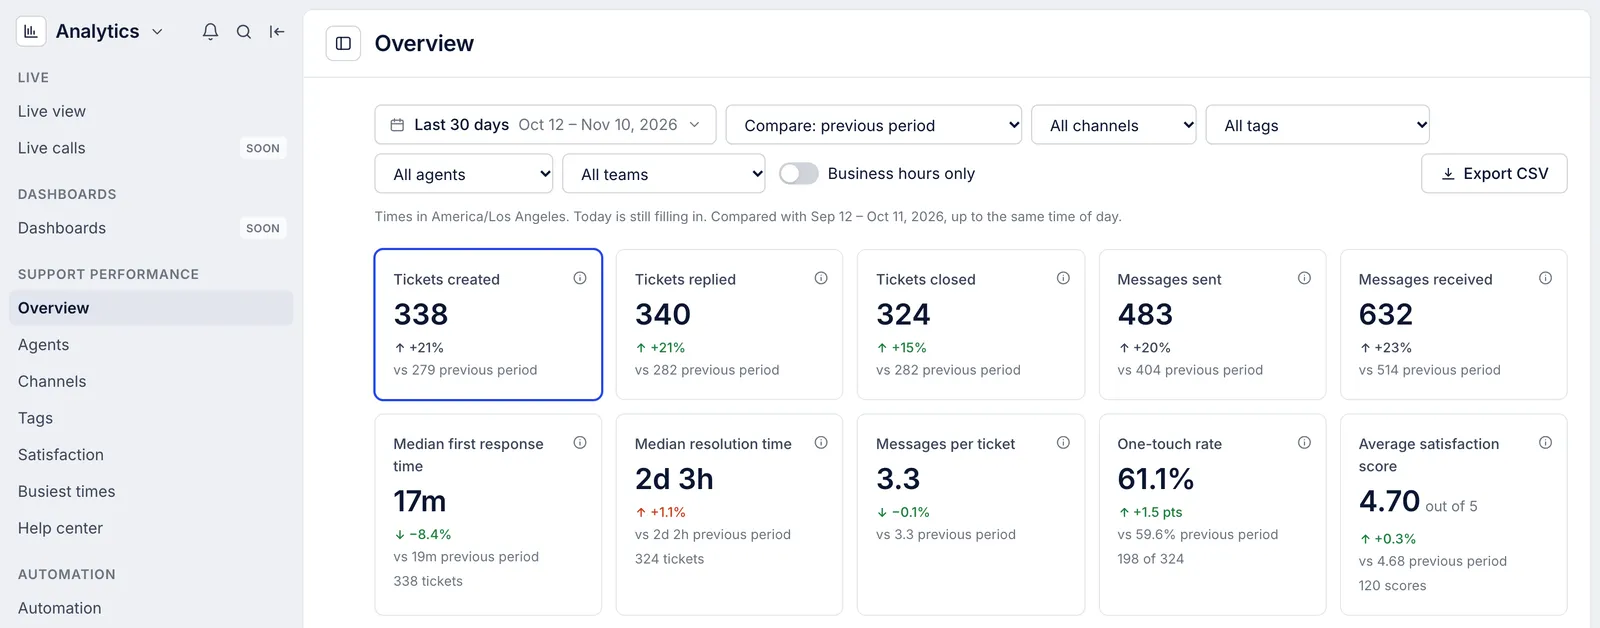
Partly availableFind the reports, read the ten headline figures on the Overview page, see how each moved against the period before and chart any of them over time.
On this page
Choose Analytics from the menu in the screen's top left corner. The Overview report opens first, showing the last 30 days against the 30 days before. Everyone on the helpdesk can open every report and download it as a CSV file, observers included.
The reports#
The list on the left groups the reports:
| Report | What it answers |
|---|---|
| Live view | What is open right now, who has it and which tickets have waited longest |
| Overview | How much came in, how fast it was answered and closed, and how customers rated it |
| Agents | The same figures for each person on the team |
| Channels | Which channels tickets arrive on and how each one is handled |
| Tags | What customers write about, by the tags on their tickets |
| Satisfaction | Survey scores, how many customers answered and what they wrote |
| Busiest times | Which hours of the week bring the most tickets and messages |
| Help center | Article views, searches and clicks on the contact card (Help center statistics) |
| Automation | What chat flows, suggested articles and order self-service settled |
| AI agent | Drafts written and used, and the skills they followed (AI Agent performance report) |
| Metrics glossary | The definition of every figure |
Dashboards carries a SOON label: dashboards you assemble yourself are not built, and the Overview and the support performance reports hold the same figures. See Reports not available yet. Live calls shows the phone queues right now; see Voice and SMS reports, and live calls.
The ten figures#
| Tile | What it counts |
|---|---|
| Tickets created | Tickets opened in the range |
| Tickets replied | Tickets a person on your team answered publicly at least once |
| Tickets closed | Tickets closed in the range that are still closed |
| Messages sent | Public replies your team sent |
| Messages received | Messages customers sent |
| Median first response time | The middle wait from a customer's first message to your team's first reply |
| Median resolution time | The middle time from opening a ticket to closing it |
| Messages per ticket | Customer messages and team replies on the tickets opened in the range, per ticket |
| One-touch rate | Of the closed tickets your team replied to, the share closed after one reply |
| Average satisfaction score | The mean of the 1 to 5 scores customers gave |
Spam, trashed and deleted tickets never count, and replies sent by rules or by a bot account are not counted as replies from your team. The metrics glossary gives the full rule for each figure. Hover the i beside a tile's name to read its definition on the page.
Under each value you see:
The change against the comparison period. Counts, times and scores change by a percentage; rates such as the one-touch rate change by percentage points, written as "pts".
The comparison value, for example "vs 279 previous period".
What the figure rests on: how many tickets a time covers, a rate's two parts ("198 of 324"), or how many scores an average uses.
A change shows in green when the figure moved the way you want (faster replies, more tickets closed, a higher score) and in red when it moved the other way. Volumes where neither direction is better, such as tickets created, stay grey. The arrow tells you the direction, so you never need the color to read it.
Charts#
The trend chart draws one figure across the range and takes its title from it, such as Tickets created over time. Pick the figure from the menu above the chart, or click its tile. The second menu sets how points are grouped: Group automatically uses days for ranges up to 45 days, weeks up to about six months and months beyond that, or choose By day, By week or By month yourself. The comparison period appears as a dashed line, lined up point by point with your range.
Tickets created and closed draws both counts on one chart, which shows whether the backlog grew or shrank.
Each point on a time, rate or score chart is worked out from that period's own tickets. The points therefore do not average to the figure in the tile, which is worked out from the whole range at once.
Every chart has Show table, which swaps the drawing for the same numbers in rows, and Show chart to switch back.
Read today's numbers with care#
The line under the filters says which time zone the report counts in and what it is compared with. When the range includes today it adds "Today is still filling in", and the comparison period stops at the same time of day, so half a day is never set against a whole one.
What the Overview does not have#
You cannot choose which tiles appear or reorder them.
Service level (SLA) results are not reported. You can save SLA policies, but tickets are not measured against them yet; see Service level targets.
Clicking a figure does not list the tickets behind it. Filter, compare and export reports shows how to find those tickets another way.
There are no benchmarks against other stores or improvement tips. Compare with your own previous period or the same dates last year instead.
Related articles
- Filter, compare and export reportsPick a date range and a comparison, narrow a report to one channel, tag, agent or team, count business hours only, share the view and download it as CSV.
- How each metric is countedThe exact rule behind every figure in Analytics, from tickets created to one-touch rate and survey response rate, and the rules all reports share.
- Agent performanceCompare each person's replies, closed tickets, response and resolution times, one-touch rate and satisfaction score, and narrow the report to one team.
- Live viewSee what is open right now, how it splits across agents and channels, who is available, and which tickets have waited longest.
Still stuck?
Write to the Growth Dept team and a person answers. Say which helpdesk you work in and what you were trying to do.