Busiest times
See which weekday and hour bring the most new tickets, customer messages or team replies, so you can plan who works when.
On this page
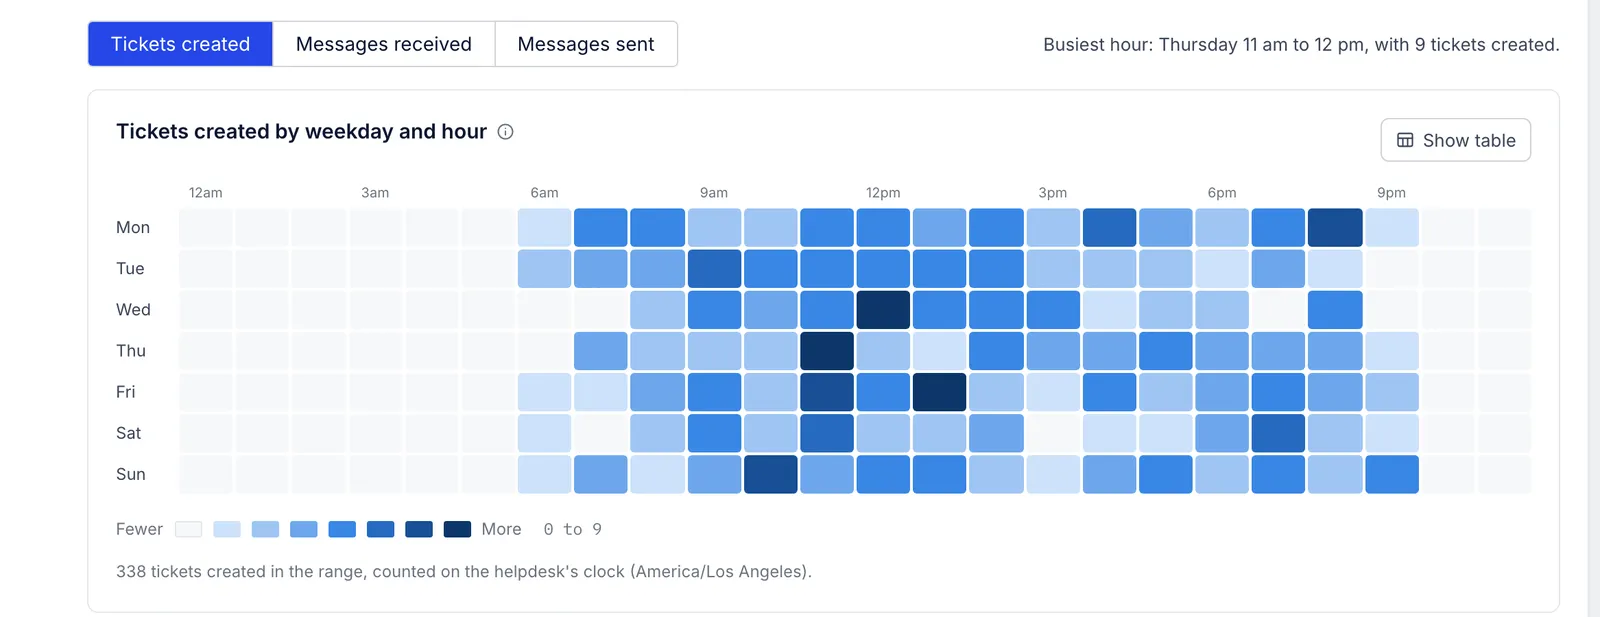
Analytics > Busiest times folds the whole date range into one week and shows it as a grid: a row for each day from Monday to Sunday and a column for each hour. The darker a square, the more happened in that hour. Hover a square for its exact count.
Choose what to count#
The buttons above the grid switch between three counts:
| Button | What each square counts |
|---|---|
| Tickets created | Tickets opened in that hour |
| Messages received | Messages customers sent in that hour, including follow-ups on open tickets |
| Messages sent | Public replies your team sent in that hour |
Next to the buttons, a line names the busiest hour, such as "Busiest hour: Thursday 11 am to 12 pm, with 9 tickets created".
How to read it#
Each square adds up every matching hour in the range. Over 30 days, the Tuesday 10 am square totals four or five Tuesdays. A longer range gives a steadier pattern; a single week can be thrown by one busy day.
Hours are on the helpdesk's clock. The note under the grid names the time zone, which is the helpdesk's own, not the one in your profile.
Compare demand with coverage. Look at Tickets created or Messages received to see when customers write, then at Messages sent to see when your team answers. Dark squares in the first that are pale in the second are hours when people are waiting.
Plan per channel. Pick a channel in the Channel menu at the top: chat often peaks at different hours from email. The Tag, Agent and Team menus work here too; with an agent picked, Messages sent counts that person's replies.
The grid does not mark your business hours. Keep your opening hours, set in Business hours and holidays, next to it when you read it. The comparison setting has no effect on this report.
Show table lists every square as a number, with a total for each weekday.
Export#
Export CSV downloads the grid for the count you have selected: one row per weekday, one column per hour from 00:00 to 23:00, and a total for each day.
Related articles
- Business hours and holidaysSet the hours your team answers customers and the days you are closed, which chat, SLAs, urgency and response-time reports all follow.
- Live viewSee what is open right now, how it splits across agents and channels, who is available, and which tickets have waited longest.
- Channel reportsSee how many tickets arrive by email, chat and contact form, how fast each channel is answered, and how to report on one channel alone.
- Analytics overviewFind the reports, read the ten headline figures on the Overview page, see how each moved against the period before and chart any of them over time.
Still stuck?
Write to the Growth Dept team and a person answers. Say which helpdesk you work in and what you were trying to do.