Filter, compare and export reports
Partly availablePick a date range and a comparison, narrow a report to one channel, tag, agent or team, count business hours only, share the view and download it as CSV.
On this page
Every report has the same row of controls at the top. Whatever you set there applies to all the figures, charts and tables below it, and to the CSV file you download.
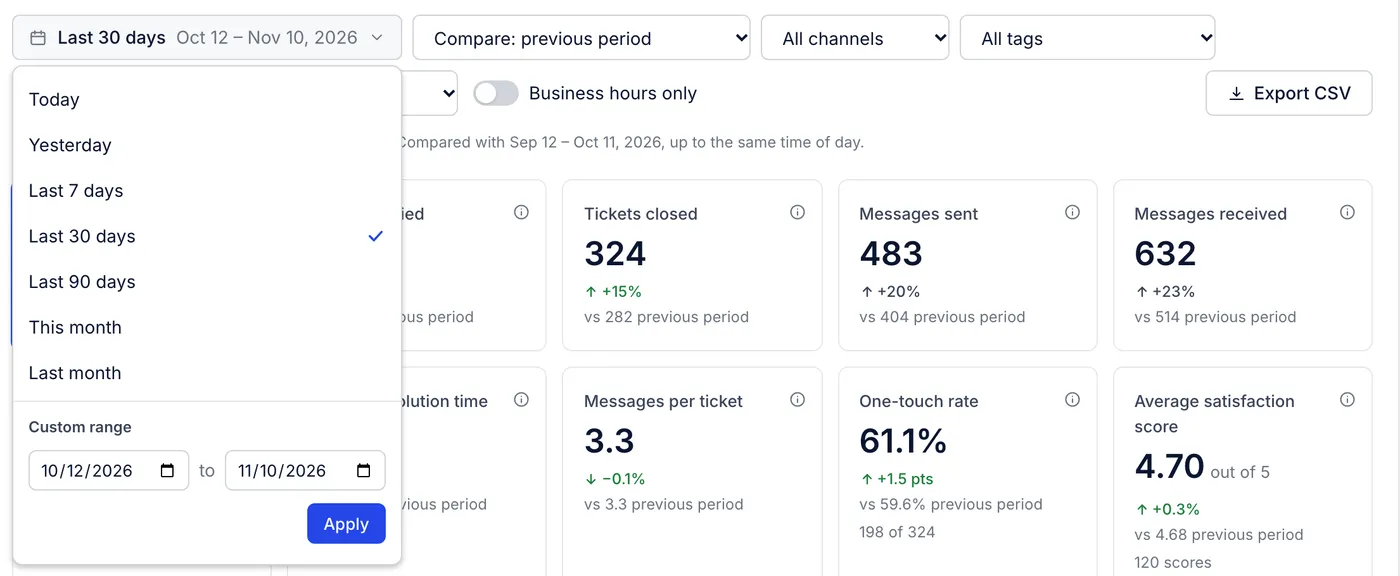
Date range#
Click the date button to choose a range:
| Choice | Dates |
|---|---|
| Today | Since midnight |
| Yesterday | The whole of yesterday |
| Last 7 days | Seven days, today included |
| Last 30 days | Thirty days, today included |
| Last 90 days | Ninety days, today included |
| This month | From the 1st to today |
| Last month | The whole previous calendar month |
| Custom range | Any start and end date, up to 731 days apart; press Apply |
Reports open on Last 30 days. Days run from midnight to midnight in the helpdesk's time zone, which the line under the filters names. When the range includes today, that line also says today is still filling in.
Comparison#
The second menu sets what each figure is compared with:
Compare: previous period, the default: the same number of days just before your range. Last 30 days is compared with the 30 days before it.
Compare: same dates last year: your dates a year earlier, which separates a seasonal rush from a real change.
No comparison: hides the changes and the dashed comparison lines.
When your range includes today, the comparison period is cut at the same time of day, so a morning is compared with a morning. The line under the filters gives the exact comparison dates.
Channel, tag, agent and team#
Each menu keeps one value at a time:
Channel keeps tickets that arrived on that channel.
Tag keeps tickets that carry that tag now.
Team keeps tickets assigned to that team.
Agent keeps one person's work. Ticket counts, closes, resolution time and satisfaction follow the person the ticket is assigned to; replies, messages sent and first response time follow the person who sent them. A note under the filters says so while an agent is picked.
Deactivated people stay in the Agent menu, marked as deactivated, so you can still report on their past work.
Business hours only#
On the Overview, Agents, Channels and Tags reports, Business hours only makes the response and resolution times count only time when your team is open. Nights, weekends and the holidays you list are left out, read on the clock of the time zone set with your business hours. A reply sent while you are closed to a message that also arrived while you were closed counts as no wait at all. Set your hours in Settings > Business hours and holidays (Business hours and holidays). Until someone saves them, weekdays from 9:00 to 17:00 in the helpdesk's time zone are used.
Counts such as tickets created do not change with this switch.
Which report takes which control#
| Report | Controls |
|---|---|
| Overview, Agents, Channels, Tags | All of them, including Business hours only |
| Satisfaction, Busiest times | Dates, comparison, channel, tag, agent and team |
| Live view | Channel, tag, agent and team; it always shows right now |
| Automation, AI agent | Dates and comparison only |
| Help center | Dates, comparison and a menu to pick one help center |
Share a report#
The address of a report page holds its filters. Copy it from your browser and send it to a teammate, and they see the same report. A preset such as Last 30 days is worked out again on the day the link is opened; a custom range keeps its dates. Choosing another report from the list on the left opens it with the default filters.
Export CSV#
Export CSV at the top right downloads the report as it is filtered. Anyone who can open a report can export it.
| Report | What the file holds |
|---|---|
| Overview | One row per day, week or month with the ten figures, then a row for the whole range |
| Live view | Each agent, their availability and their open tickets, then the unassigned tickets |
| Agents | One row per person and an All agents row, with the number of scores behind each average |
| Channels | One row per channel and an All channels row, with the comparison period's ticket count |
| Tags | One row per tag, with the comparison count, and a No tag row |
| Satisfaction | One row per period, then the whole range with how many of each score; no comments |
| Busiest times | The weekday by hour grid for the count you selected |
| Automation | The flows table |
The file name gives the helpdesk, the report and the dates, for example harborpine-overview-2026-10-12-to-2026-11-10.csv. Times are in whole seconds and rates run from 0 to 1, so a spreadsheet can total and chart them; format them as you like there. Names that begin with =, +, - or @ get an apostrophe in front so a spreadsheet does not treat them as formulas.
Not available#
Listing the tickets behind a number. Clicking a figure does nothing. To read the tickets themselves, build a view with the same conditions, such as a tag and a channel (Views and sections). The live view's oldest tickets and the satisfaction comments do link to their tickets.
Saved filters. Bookmark the report's address instead.
Several values in one filter, such as two tags or every channel but one, and filters on ticket fields. The reporting API takes "one of", "none of" and, for tags, "all of" filters on channels, agents, teams, tags and integrations; see The REST API and API keys.
PDF export and adding charts to a dashboard of your own.
Related articles
- Analytics overviewFind the reports, read the ten headline figures on the Overview page, see how each moved against the period before and chart any of them over time.
- How each metric is countedThe exact rule behind every figure in Analytics, from tickets created to one-touch rate and survey response rate, and the rules all reports share.
- Business hours and holidaysSet the hours your team answers customers and the days you are closed, which chat, SLAs, urgency and response-time reports all follow.
- The REST API and API keysFind your API address, create and revoke keys, and connect your own scripts and tools to the helpdesk, including tools written for Gorgias.
Still stuck?
Write to the Growth Dept team and a person answers. Say which helpdesk you work in and what you were trying to do.